
Statistics • Analysis • Learning
Master Statistics with
Tools, Tests, Articles, and Courses
Your all-in-one statistics learning and analytics platform with 255+ statistical tests, calculators, reports, distributions, and expert-written resources.

Everything You Need in One Place
One integrated platform for learning statistics, looking things up, and running your own analysis.
Popular Tools and Statistical Tests
A sample of the 255+ tests and reference distributions in the library.
Professional Reports
Generate clear reports with methods, tables, charts, assumptions, and interpretation.
Built-in Sample Data
Try tools immediately without formatting or uploading your own data.
Beginner to Advanced
Move from foundational concepts to technical derivations and specialized methods.
Connected Learning
Move naturally among dictionary definitions, articles, calculators, tests, courses, and books.
Latest from StatisticsCorner
In-depth, derivation-first explanations of statistical methods -- free to read, and citable.
Linear Regression, Part 4: Diagnosing Linear Regression -- When Your Estimates Are Wrong
Three problems that no amount of data fixes -- with a real dataset where dropping one variable shifts a coefficient by exactly a provable amount, a simulation where a coefficient converges to the wrong number at one million observations, and a market where OLS cannot tell supply from demand
The fourth installment of the Linear Regression series, turning to the second and more serious failure bucket the series is organized around: problems that violate exogeneity itself (A3), so that OLS's coefficient estimates no longer converge to the truth even as the sample grows without bound -- a categorically worse failure than Part 3's, where more data at least helped once the right correction was applied. Covers omitted variable bias with a real, exactly-verifiable example (dropping horsepower from a weight-on-mpg regression shifts the weight coefficient from -3.878 to -5.344, matching the Frisch-Waugh-Lovell identity to thirteen decimal places), classical measurement-error attenuation (injecting realistic noise into a real predictor shrinks its coefficient toward zero and keeps it there through n=320,000), and simultaneity bias (a simulated supply-and-demand market where a naive regression of quantity on price converges cleanly, even at a million observations, to a number that is neither the true demand slope nor the true supply slope). Closes with an explicit, honest statement that neither Part 3's diagnostics nor Part 5's upcoming remedies fix any of these -- that requires instrumental variables and two-stage least squares, which Part 7 develops properly.
Linear Regression, Part 3: Diagnosing Linear Regression -- When Your Standard Errors Lie
Three problems that leave the coefficients themselves untouched and quietly wreck everything built on top of them -- with a real dataset where a naive standard error is off by 3.6x, and a simulation where a nominal 5% test rejects a true null 76% of the time
The third installment of the Linear Regression series, covering the first of two failure buckets the series is organized around: problems that leave OLS's coefficient estimates exactly as unbiased as Part 2 proved, but wreck every standard error, t-test, F-test, and confidence interval built on top of them. Unifies heteroskedasticity and autocorrelation under one derivation -- the general 'sandwich' variance formula (X'X)^{-1}X'ΩX(X'X)^{-1}, which collapses to Part 2's familiar σ^2(X'X)^{-1} only when Ω=σ^2I exactly -- then treats each with a real worked example: Engel's 1857 food-expenditure data, where the naive standard error understates the robust HC0 estimate by 3.6x, and Longley's macroeconomic data plus a Granger-Newbold (1974) spurious-regression simulation, where a nominal 5% test rejects a true null of no relationship 76.5% of the time. Closes with multicollinearity, deliberately treated as a different mechanism entirely -- not a broken formula but a correct formula applied to a design matrix where (X'X)^{-1} is itself large -- with an explicit, honest statement that neither this article's diagnostics nor Part 5's remedies fix it; that fix is the site's already-published Ridge Regression, Lasso Regression, and Elastic Net trilogy.
Linear Regression, Part 2: Ordinary Least Squares and the Gauss-Markov Theorem
The estimator, derived; the exact assumptions it needs, catalogued precisely by what each one buys; the theorem proving it is the best available under those assumptions -- proved on paper and then shown, in a Monte Carlo simulation, to actually be true
The second installment of the Linear Regression series, turning Part 1's model equation into an actual estimator and the full inference machinery built on top of it. Derives the OLS normal equations and closed-form solution, then catalogues the classical assumptions precisely by what each one buys -- unbiasedness from exogeneity alone, the Gauss-Markov theorem's best-linear-unbiased-estimator guarantee from adding homoskedasticity and no autocorrelation, and exact finite-sample inference from normality on top of that -- explicitly mapping each assumption to the later article that covers its failure. Proves Gauss-Markov in full (the classic C=(X'X)^{-1}X'+D argument) and then, because a proof on paper is not the same as watching it happen, confirms it by Monte Carlo simulation: a genuinely unbiased alternative estimator built from only two of fifty real data points shows almost exactly the 4.68x variance penalty the theorem predicts. Builds the standard error, t-test, F-test, and R-squared machinery, then gives the confidence-interval-versus-prediction-interval distinction its own full treatment with real numbers -- a 9-foot-wide confidence band next to a 62-foot-wide prediction band from the identical fitted line, on the same cars dataset introduced in Part 1.
Linear Regression, Part 1: Origins and What "Linear" Actually Means
The first installment of a complete reference on linear regression -- where the model actually came from (it is not one story but two), and why a model can bend like a curve on the page and still be, in the only sense that matters to the mathematics, linear
The opening article of a seven-part series covering linear regression end to end. Untangles a history that is really two separate inventions eighty years apart: Legendre (1805) and Gauss (1809, claiming 1795) developed least squares for astronomy with no notion yet of regression, while Galton's 1886 study of height introduced the statistical concept and word, formalized mathematically by Pearson (1896) and extended to multiple predictors by Yule (1897, 1899). Lays out the model equation, the design matrix, and the fixed-versus-stochastic-X distinction that quietly determines what 'unbiased' means and previews exactly where Part 4's endogeneity problems come from. The centerpiece is the article's title claim itself: the precise, commonly conflated difference between linearity in the variables and linearity in the parameters, illustrated with two real, numerically verified datasets -- a quadratic and a log-log fit on the classic cars stopping-distance data (both linear in the parameters despite curving visibly), and the Puromycin enzyme-kinetics dataset, where the genuinely nonlinear Michaelis-Menten model is fit two ways to show that the classic Lineweaver-Burk linearizing shortcut is not a free simplification -- it measurably costs accuracy relative to a direct nonlinear fit on the same data. Closes with the transformation toolkit (log-log, log-lin, Box-Cox) that lets real curved relationships stay inside the linear-in-parameters framework the rest of the series builds on.
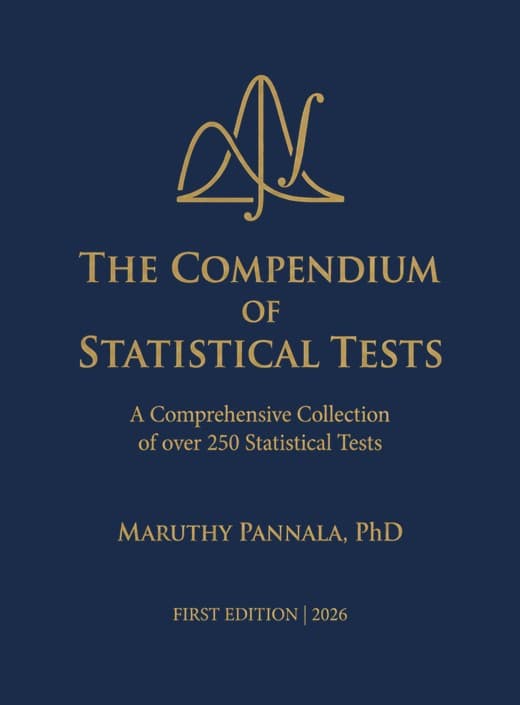
The Compendium of Statistical Tests
A comprehensive reference covering 255+ statistical tests across 25 chapters, with conceptual primers, assumptions, hypotheses, formulas, and implementation guidance.